Service and App Metrics in ASP.Net Core 2 - Part 1
I've been looking at monitoring ASP.Net Core Microservices lately and I'm really feeling the need to get a good application and service monitoring system in place, to detect issues and to improve efficiencies of the systems we have. For this, I'll create a series of posts to document the discoveries and journey as it may be helpful to others.
Metrics Metrics Metrics!
Adding metrics to your Microservice is vital in this day and again. Without them, the management of an ever-growing number of microservices becomes unwieldy and in fact you may not know what your service is doing. It even could be down without you knowing.
Prometheus is a protocol for exposing service and application metrics. With an associated endpoint, a scraping service can pull the metrics from your application for using graphing and/or alerting systems.
One emerging pattern in the Industry appears to be to use Prometheus to grab and expose metrics to a Prometheus scraper (another service). Ideally from here they are inserted into a timeseries database to allow for point in time analysis and graphing later.
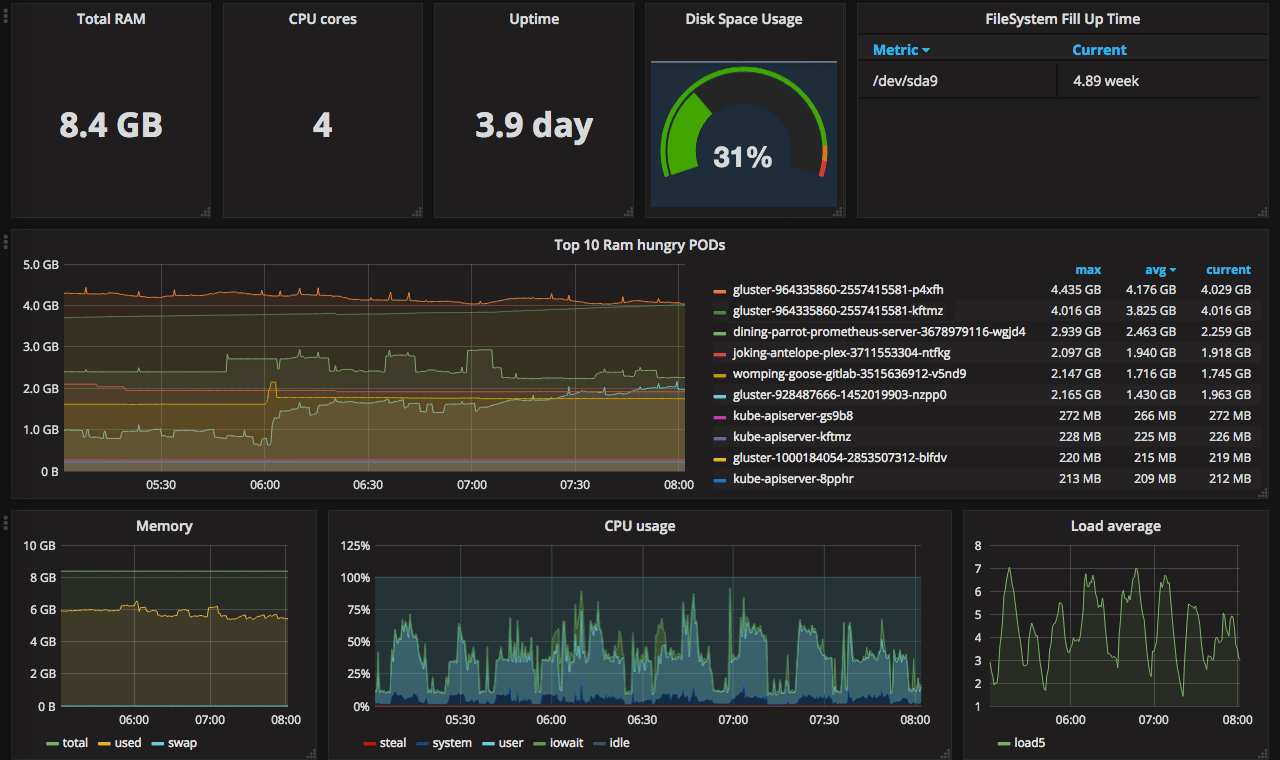
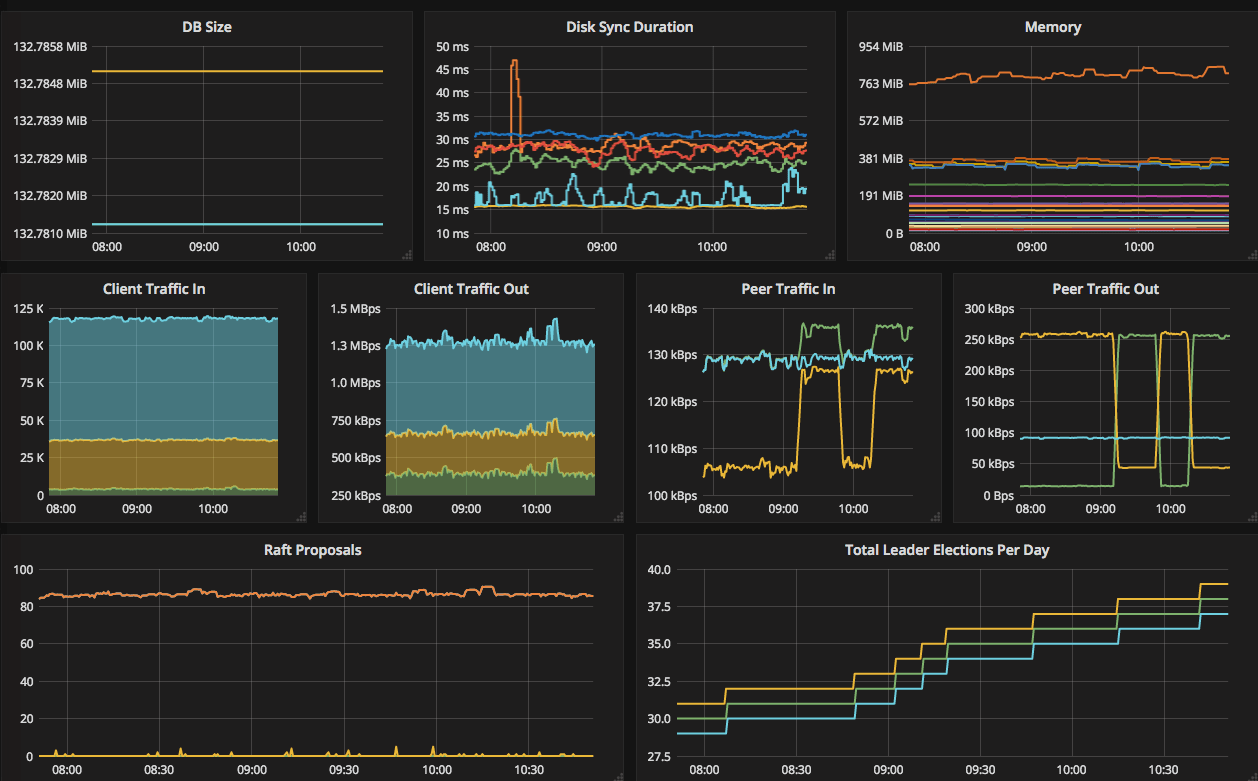
Now we have our data in a database we need to graph it, set alerts and action them if needed. Grafana solves this problem for us here. That's the general idea. At the end of this we should be able to get some pretty cool dashboards to show the state of our app, just like this
The ASP.Net Core Perspective.
For now, we're concerned with out ASP.Net Core 2 application and how to get the Prometheus endpoint up and running, exposing our service and application metrics.
Although there are no official plugins at time of writing, the beautiful world of open source has created some for us to use.
I've looked at a few NuGet plugins for this namely:
- Prometheus-Net from andrasm
- Prometheus.Client from phnx47
- Nexogen.Libraries.Metrics from nexogen-international
Prometheus-Net
Although suggested on the Prometheus site does not have .Net Core support yet. Checkout out this PR for more info
Prometheus.Client is a working fork of Prometheus-Net but by default we don't get any service metrics and doesn't seem to have a large community around it at present.
Nexogen.Libraries.Metrics seems to be a winner and was pretty easy to setup. It's got active development, a nice number of stars on GitHub and you also seem to get default app metrics out of the box.
Setting up A Prometheus Endpoint
Nexogen.Libraries.Metrics has got some nice docs on the GitHub help page to set it up but there were one or two things I has to dive into the code to see what's going on and how to use it.
Run on the console in the root web app project:
dotnet add package Nexogen.Libraries.Metrics.Prometheus.AspCore
This will install all the dependant packages which are described on the read me page, no need to include each of them.
The package uses ASP.Net Core Middleware to setup a metrics endpoint for your app. In Startup.cs we need to plug this config in, like so:
Add the Prometheus service to the default IOC container (or you're prefered IOC like Autofac):
Add the Prometheus config to the HTTP Request Pipeline:
(Note: looking at the source and what's available in NuGet it looks like the NuGet plugin is a little behind, as the source takes an Options parameters here.)
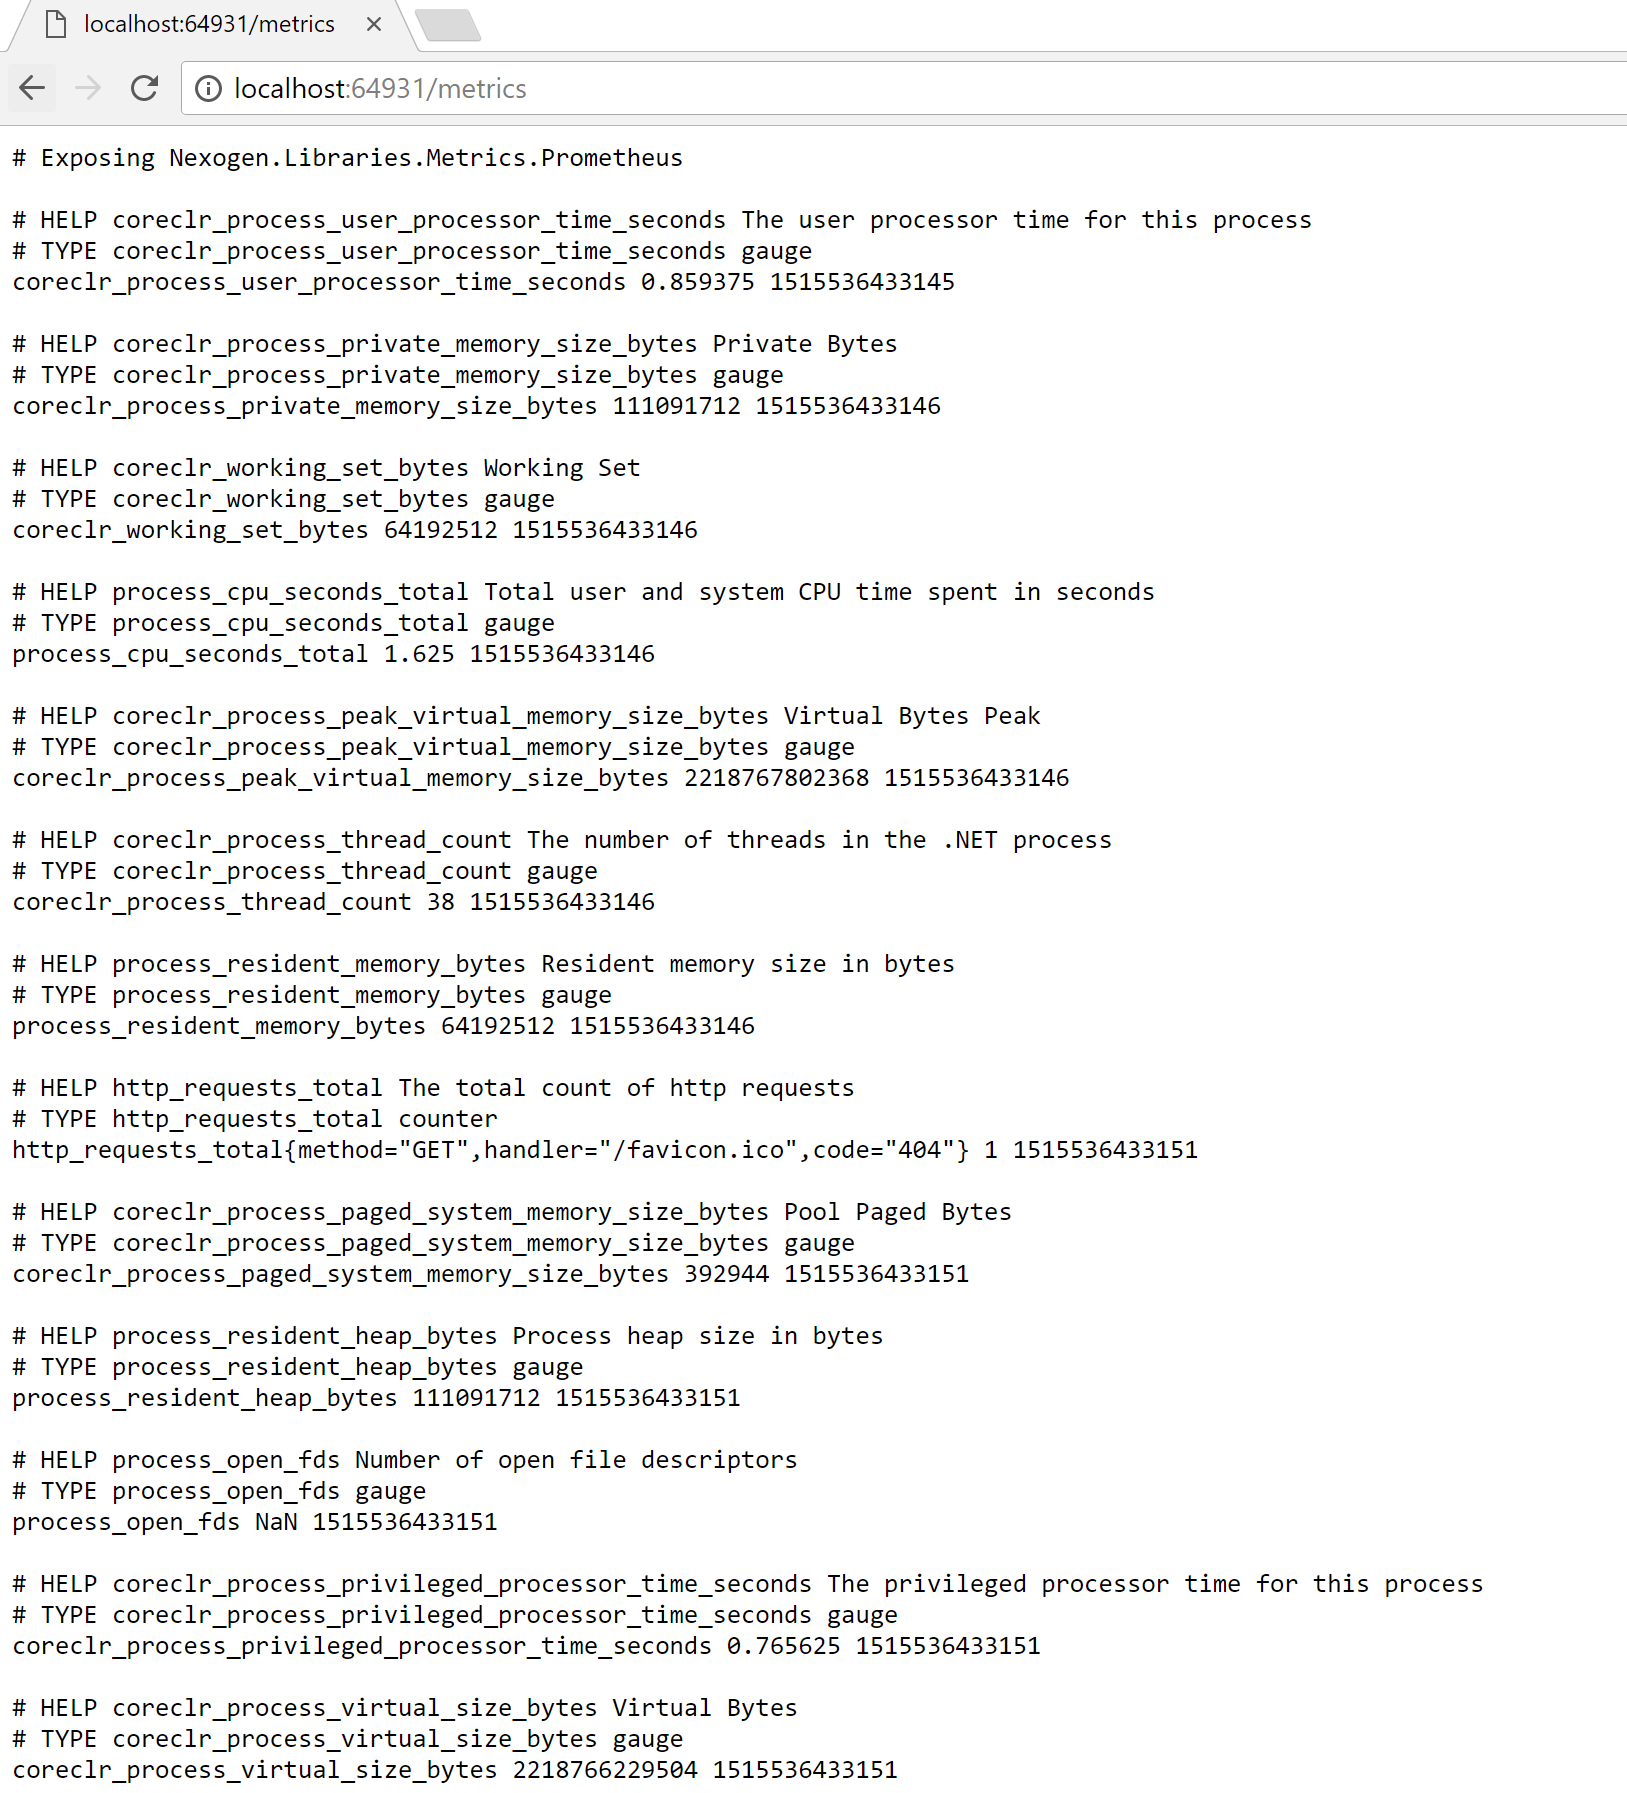
And that's it. When you run the app in the Debugger, navigate to http://localhost:{port}/metrics and you should be able to see all the default metrics exposed via the Prometheus Protocol. And it should look something like this:
The Prometheus Plugin and the Bridge Design Pattern
Along the way of this adventure, the Prometheus plugins in .Net Core specifically have come a long way and as such during this process I've switched from using Nexogen to the Prometheus-Net plugin.
Prometheus-Net appears to have more active contributers, and at the time of writing supports metric labeling as well as Summary Metics. Given I have used a bridge pattern here to integrate the plugin with services, it's been a very trivial switch, taking about 15 minutes or so to do. I'd recommend all to do implement this pattern when something is likely to change in future, it just means you have to change your code in one place rather than many which is always annoying.
Metric Naming
Another important point with Prometheus is metic naming. When exposing any prometheus metrics, it's best to following a standard naming convention, so engineers and developers can understand them more easily.
Secondary to this, it allow us to use metric labeling and thus reduce large amounts of metrics in our code. So for example having a counter_http_requests_failed, and counter_http_request_ssucceeded could be condenced into http_requests_totals with labels for http 200, and http 400 or any other http status code we want. We can apply a similar metrics to each endpoint and capture the status codes for each request response. More on this can be found here
What to do next...
Next adding custom metrics to your application is pretty simple with the prometheus libraries. Registering the metric onces at start-up and then each time in code you want to register a new event you can do so.
After that then it's a matter of storing the metrics in a time-serices database like InfluxDB and finally displaying the events on Grafana for example. I won't cover that here. Althrough Prometheus and it's eco-system is pretty good when you get into it, I've actually moved to Azure based services instead. For me a lot of integrations you get by default after the initial wiring up. You also get a really rich and easy to use query language using Kusto in Azure. From a metrics technology specifically this means using Application Insights and Log Analytics for monitoring my production applications.
The next post in this series will cover metrics in Azure.